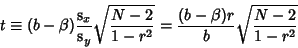
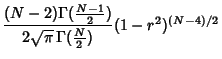
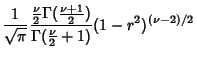
For a Gaussian Bivariate Distribution, the distribution of correlation Coefficients is given by
where  is the population correlation Coefficient,
 is a Hypergeometric Function, and
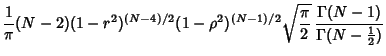
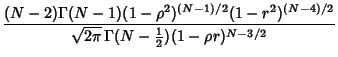
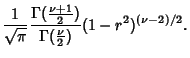
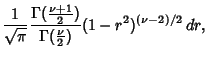
 is the Gamma Function (Kenney and Keeping 1951, pp. 217-221). The Moments are
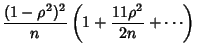
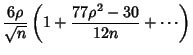
where  . If the variates are uncorrelated, then
  and
and
so
But from the Legendre Duplication Formula,
 |
(7) |
so
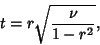
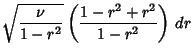
The uncorrelated case can be derived more simply by letting  be the true slope, so that
 . Then
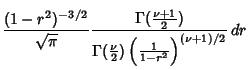
 |
(9) |
is distributed as Student's t-Distribution with  Degrees of
Freedom. Let the population regression Coefficient be 0, then
Degrees of
Freedom. Let the population regression Coefficient be 0, then  , so
, so
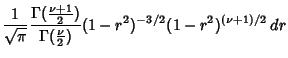
 |
(10) |
and the distribution is
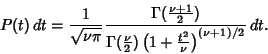 |
(11) |
Plugging in for  and using
gives
so
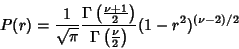 |
(14) |
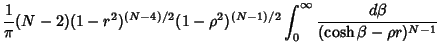
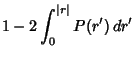
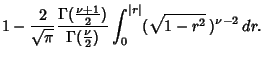
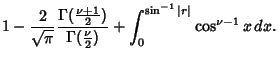
as before. See Bevington (1969, pp. 122-123) or Pugh and Winslow (1966, §12-8). If we are interested instead in the
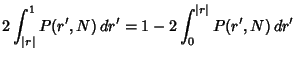
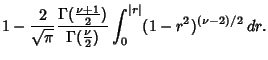
probability that a correlation Coefficient would be obtained  , where
 is the observed Coefficient, then
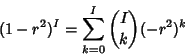
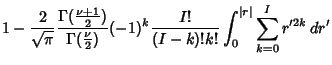
Let
 . For Even
  , the exponent
  is an Integer so, by the Binomial
Theorem,
is an Integer so, by the Binomial
Theorem,
 |
(16) |
and
For Odd , the integral is
Let  so
so
 , then
But is Odd, so
 is Even. Therefore
Combining with the result from the Cosine Integral gives
![\begin{displaymath}
P_c(r)=1-{2\over \pi}{(2n)!!(2n-1)!!\over (2n-1)!!(2n)!!}\le...
...er (2k+1)!!}\cos^{2k+1}x+ x}\right]_0^{\sin^{-1}\vert r\vert}.
\end{displaymath}](c3_318.gif) |
(21) |
Use
 |
(22) |
and define
 , then
![\begin{displaymath}
P_c(r)= 1-{2\over \pi} \left[{\sin^{-1}\vert r\vert+\vert r\vert\sum_{k=0}^J {(2k)!!\over (2k+1)!!} (1-r^2)^{k+1/2}}\right].
\end{displaymath}](c3_321.gif) |
(23) |
(In Bevington 1969, this is given incorrectly.) Combining the correct solutions
![\begin{displaymath}
P_c(r) = \cases{
1-{2\over\sqrt{\pi}} {\Gamma[(\nu+1)/2]\ove...
...}(1-r^2)^{k+1/2}}\right]\cr
\quad {\rm for\ }\nu{\rm\ odd}\cr}
\end{displaymath}](c3_322.gif) |
(24) |
If  , a skew distribution is obtained, but the variable
  defined by
 |
(25) |
is approximately normal with
(Kenney and Keeping 1962, p. 266).
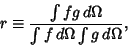
Let  be the slope of a best-fit line, then the multiple correlation Coefficient is
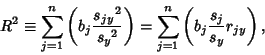 |
(28) |
where  is the sample Variance.
On the surface of a Sphere,
 |
(29) |
where  is a differential Solid Angle.
This definition guarantees that
is a differential Solid Angle.
This definition guarantees that  . If
. If  and
and  are expanded in Real Spherical Harmonics,
Then
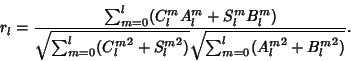 |
(32) |
The confidence levels are then given by
where
 |
(33) |
(Eckhardt 1984).
See also Fisher's z'-Transformation, Spearman Rank Correlation Coefficient,
Spherical Harmonic
References
Bevington, P. R. Data Reduction and Error Analysis for the Physical Sciences. New York: McGraw-Hill, 1969.
Eckhardt, D. H. ``Correlations Between Global Features of Terrestrial Fields.'' Math. Geology 16,
155-171, 1984.
Kenney, J. F. and Keeping, E. S. Mathematics of Statistics, Pt. 1, 3rd ed. Princeton, NJ: Van Nostrand, 1962.
Kenney, J. F. and Keeping, E. S. Mathematics of Statistics, Pt. 2, 2nd ed. Princeton, NJ: Van Nostrand, 1951.
Pugh, E. M. and Winslow, G. H. The Analysis of Physical Measurements. Reading, MA: Addison-Wesley, 1966.
© 1996-9 Eric W. Weisstein
1999-05-25
![$\displaystyle \mathop{\times}
\left[{1+{1\over 4} {\rho r+1\over 2N-1} +{9\over 16} {(\rho r+1)^2\over (2N-1)(2N+1)} +\cdots}\right],$](c3_256.gif)

![$\displaystyle {\Gamma(N-{\textstyle{1\over 2}})2^{3/2-N}\sqrt{\pi}\over [\Gamma({\textstyle{N\over 2}})]^2},$](c3_271.gif)
![$\displaystyle {(N-2)\Gamma(N-1)\over \sqrt{2\pi}\,\Gamma(N-{\textstyle{1\over 2...
...tstyle{1\over 2}}) 2^{3/2-N}\sqrt{\pi}\over [\Gamma({\textstyle{N\over 2}})]^2}$](c3_272.gif)
![$\displaystyle {2^{1-N}(N-2)\Gamma(N-1)\over [\Gamma({\textstyle{N\over 2}})]^2}
(1-r^2)^{(N-4/2)}.$](c3_273.gif)
![$\displaystyle {(2^{1-N})(2^{N-2})(N-2)\Gamma({\textstyle{N\over 2}})\Gamma({\te...
...over 2}})\over\sqrt{\pi}\,[\Gamma({\textstyle{N\over 2}})]^2}
(1-r^2)^{(N-4)/2}$](c3_275.gif)
![$\displaystyle \sqrt{\nu} \left[{\sqrt{1-r^2}-r({\textstyle{1\over 2}})(-2r)(1-r^2)^{-1/2}\over 1-r^2}\right]\,dr$](c3_287.gif)

![$\displaystyle {1\over \sqrt{\nu\pi}} {\Gamma({\textstyle{\nu+1\over 2}})\over
\...
...left[{1+{r^2\nu\over(1-r^2)\nu}}\right]^{(\nu+1)/2}}\sqrt{\nu\over (1-r)^3}\,dr$](c3_291.gif)
![$\displaystyle 1-{2\over\sqrt{\pi}} {\Gamma({\textstyle{\nu+1\over 2}})\over \Ga...
...k=0}^I \left[{(-1)^k{I!\over (I-k)!k!} {\vert r\vert^{2k+1}\over 2k+1}}\right].$](c3_307.gif)
![$\displaystyle 1-{2\over\sqrt{\pi}} {\Gamma[({\textstyle{\nu+1\over 2}})]\over \...
...tstyle{\nu\over 2}})}
\int_0^{\sin^{-1} \vert r\vert} \cos^{\nu-2}x \cos x \,dx$](c3_312.gif)

![$\displaystyle \sum_{l=0}^\infty \sum_{m=0}^l [C_l^m {Y_l^m}^c(\theta,\phi)\sin(m\phi)+S_l^m {Y_l^m}^s(\theta, \phi)]$](c3_337.gif)
![$\displaystyle \sum_{l=0}^\infty \sum_{m=0}^l [A_l^m {Y_l^m}^c(\theta,\phi)\sin(m\phi)+B_l^m {Y_l^m}^s(\theta, \phi)].$](c3_339.gif)